Immediate Vault Immediate Access

August P&C Rates Flatten in U.S.

The August 2015 composite rate for property and casualty insurance placements in the United States were flat or showed no change compared to the July 2015 composite rate, Aug-Market Scout
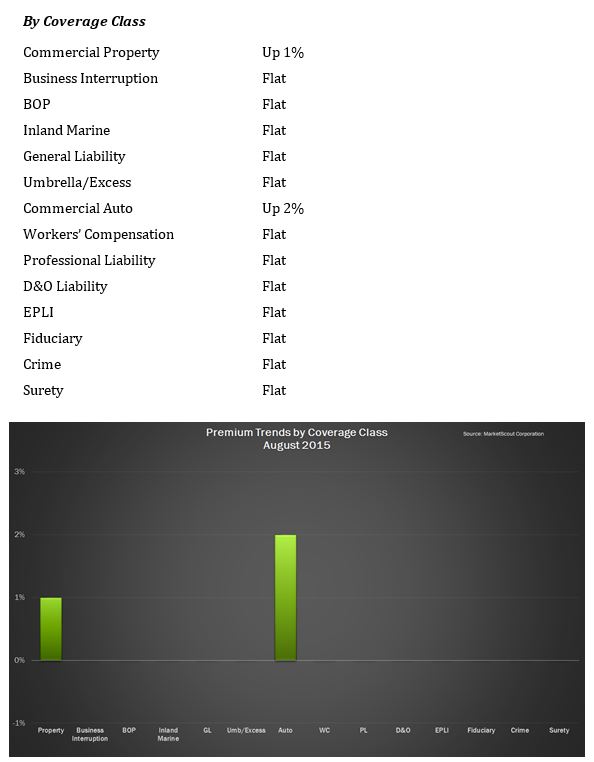
which was up 1%, according to MarketScout.

“Thus far, 2015 is proving to be a steady year.

buy lariam online www.mariettaderm.com/wp-content/uploads/2022/08/pdf/lariam.html no prescription pharmacy

Rates were up very slightly in February and July but all other months were flat,” said Richard Kerr, chief executive officer of MarketScout.

buy champix online www.mariettaderm.com/wp-content/uploads/2022/08/pdf/champix.html no prescription pharmacy

“Again, it appears soft markets are not as soft as they once were and hard markets aren’t as hard. The cycles are moderating, probably because underwriters have so many tools to assure pricing is appropriate. These tools and increased board level oversight keep the cowboys in check—at least most of the time.”

All accounts with premiums under $1,000,000 were flat. Insureds with premiums in excess of $1,000,000 paid 3% less than in the same period last year. “Clearly, large insurance buyers are getting preferential pricing from insurers,” MarketScout said.

Rates by coverage classification were flat except for commercial auto, which was up 2%, and commercial property, which was up 1%.

buy keflex online www.mariettaderm.com/wp-content/uploads/2022/08/pdf/keflex.html no prescription pharmacy

By industry classification, all rates were flat except manufacturing, which was down 1%, and transportation, which was up 2%.

Summary of August 2015 rates by coverage, industry class and account size:

Coverage-1

Account-2Industry-3

Piracy Incidents Down

Steps taken by the international maritime community have paid off, reducing the threat of piracy in the Arabian Sea’s Gulf of Aden, according to the Allianz Global Corporate & Specialty Safety and Shipping Review 2014. The number of ships seized and hostages taken was down significantly in 2013. According to the International Maritime Bureau (IMB), piracy at sea is at the lowest level in six years—264 attacks were recorded worldwide in 2013, a 40% drop since Somali piracy peaked in 2011. There were 15 incidents reported off Somalia in 2013, including Gulf of Aden and Red Sea incidents—down from 75 in 2012, and 237 in 2011 (including attacks attributed to Somali pirates in the Gulf of Aden, Red Sea and Oman).

But while the number of incidents in this region has gone down, piracy attacks in other areas have increased in frequency, notably Indonesia and off the west coast of Africa. While most of these Indonesian attacks remain local, low level opportunistic thefts carried out by small bands of individuals, a third of the incidents in these waters were reported in the last quarter of 2013, meaning there is potential for such attacks to escalate into a more organized piracy model unless they are controlled.

The Gulf of Guinea region accounted for 48 of the 264 incidents in 2013. Of these, Nigerian pirates and armed robbers were responsible for 31 incidents, including two hijackings, 13 vessel boardings and 13 vessels fired upon. One crew member was killed and 36 kidnapped—the highest number of Nigerian kidnappings for five years, according to the IMB.

Marine Losses Continue Downward Trend

The marine industry continued to see a steady decline in the number of large ships losses globally since 2002, with 94 ships lost in 2013, down 20% from 117 reported in 2012, according to a study by Allianz.

The “Safety and Shipping Review 2014” by Allianz Global Corporate & Specialty found that of ships lost, the largest number, 32, were cargo vessels; 14 were fishing vessels; and 12 were bulk shipments. Only six passenger ships were lost, the survey found. The most common cause of losses in 2013, and over  the last 12 years, was foundering (sinking or submerging). The demise of 69 ships accounted for nearly three-quarters of all losses—with bad weather a significant driver.

Worldwide there were 1,673 losses from Jan. 1, 2002-Dec. 31, 2013, with an average of 139 per year. The top geographic area for losses has been South China, Indo China, Indonesia and Philippines. The area including British Isles, North Sea, English Channel and Bay of Biscay is still ranked fourth, despite improvement. With 45 losses overall, the U.S. eastern seaboard improved in 2013, dropping out of the top 10 regions.

According to the study, January is the worst month for all casualties in the Northern Hemisphere. There were 23% more losses in January compared with the quietest month, June. In the Southern Hemisphere July sees 41% more losses than April.

The majority of losses are caused by machinery damage, the reason for most losses in marine insurance. Statistics from the International Union of Marine Insurance (IUMI) report that 40% of hull claims are machinery damage and account for 20% of costs.

The review found that while piracy is still a threat, it has also subsided. Piracy at sea reached its lowest levels in six years, with 264 attacks recorded worldwide in 2013, a 40% drop since Somali piracy peaked in 2011. Fifteen incidents were reported off Somalia in 2013, including Gulf of Aden and Red Sea incidents, down from 75 in 2012, and 237 in 2011 (including attacks attributed to Somali pirates in Gulf of Aden, Red Sea and Oman).

According to the study: “The very real threat of piracy for ships operating in the Gulf of Aden reached the general public last year as the Hollywood Oscar-nominated blockbuster Captain Phillips was released. Tom Hanks played the lead as the master of the pirated Mærsk Alabama, broadcasting the piracy problem to a much wider audience and raising awareness of its consequences. The steps that the international maritime community has taken to reduce the threat of piracy in the Gulf of Aden have been extremely successful with the number of ships seized and hostages taken in 2013 significantly down on 2012.”

Lower losses overall were attributed to a number of factors including increased regulation, which has helped the maritime industry improve its safety record. Because the quality of operations varies in different regions, however, there is a big need for universal regulations on ship safety to reduce the risk of casualties and loss of life, the survey concluded.


Disaster Losses Down From 2012

Windstorm Xaver: Model shows a large area of high winds in the lower atmosphere pushing waters of the North Sea into the coasts around western Europe. Courtesy WeatherBELL Analytics.

Natural catastrophes and man-made disasters worldwide reached $44 billion in insured losses in 2013—down from $81 billion in 2012, according to a Sigma preliminary report by Swiss Re.

The study found that total economic losses from disasters in 2013 totaled $130 billion and 25,000 lives were lost. Hurricane Haiyan alone, which hit the Philippines in November with record-breaking winds, claimed more than 7,000 lives. In 2012 total economic losses were $196 billion and 14,000 lives were lost.

Flooding in central and Eastern Europe in June 2013 created overall losses of $18 billion, with insured losses estimated at $4 billion, according to the report.

In the United States, severe spring and autumn weather spawned thunderstorms and deadly tornadoes. While this caused devastation of personal and commercial properties and heavy losses to the insurance industry, the 2013 North Atlantic hurricane season proved to be benign, the report found.

Alberta, Canada in June experienced flooding caused by heavy rains. Insured losses were about $2 billion—the highest ever recorded in the country for any disaster.

The most costly insured catastrophe losses in 2013

Date Insured losses
(US $B)
Economic losses
(US $B)
Event Country
1 June 4.1 18.0 Floods Germany, Czech Republic
2 July 3.4 3.8 Hailstorm Andreas Germany, France
3 June 1.9 4.8 Floods Canada
4 May 1.8 3.2 Severe thunderstorms, tornadoes US
5 March 1.6 2.2 Thunderstorms, tornadoes, hail US
6 May 1.4 2.0 Severe thunderstorms, tornadoes, large hail US
7 October 1.4 2.7 Windstorm Christian Germany, Denmark
8 April 1.1 1.6 Snow storm, ice, tornadoes, heavy rains US
9 December 1.0 1.4 Windstorm Xaver UK, Denmark
10 January 1.0 1.5 Floods caused by Cyclone Oswald Australia

Swiss Re Sigma preliminary estimates