The number of captive insurers continues to increase globally, from 5,000 in 2006 to more than 7,000 in 2016. Once formed primarily by large companies, the captive market has opened up to mid-size and small businesses. The industry is also seeing a trend in companies forming more than one captive, using them for cyber, political risk and other exposures, according to a recent Marsh report, Captives at the Core: The Foundation of a Risk Financing Strategy.
Organizations are seeing disruptions in a number of areas and are relying more on their existing captives, Marsh said. Because of their flexibility, captives are also being used to respond to market cycles and organizational changes such as mergers and acquisitions.
While North America and Europe still dominate in numbers of captives, other regions have shown more interest in the past three years. In Latin America, captive formation increased 11% in 2016, the study found.
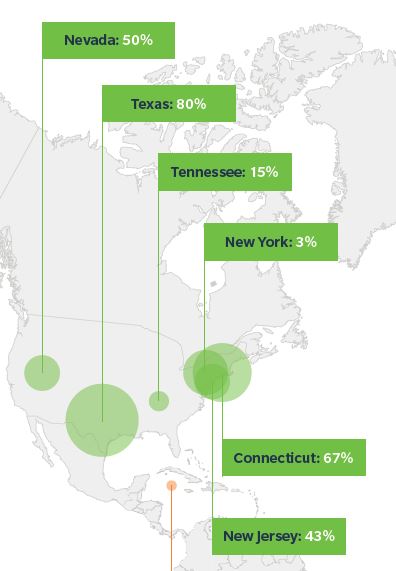
Within the United States, there is more competition among domiciles and some of the newer domiciles are experiencing growth. The top-growing U.S. domiciles in 2016 were Texas, Connecticut, Nevada, New Jersey, Tennessee, and New York. Domiciles outside the U.S. seeing the most growth include Sweden, Guernsey, Singapore, Malta, and the Cayman Islands.
 As organizations’ exposures increase in number, complexity and severity, shareholder funds generated by captives are becoming more important. According to Marsh:
For many clients, captives are at the core of their risk management strategy, going beyond the financing of traditional property/casualty risks.
Specifically, we are seeing an increase in parent companies using captive shareholder funds to underwrite an influx of new and non-traditional risks, including cyber, supply chain, employee benefits, and terrorism, as well as to develop analytics associated with these risks and fund other risk management initiatives.
Risk management projects funded by captive shareholder funds in 2016 included initiatives to determine capital efficiency and optimal risk retention levels in the form of risk-finance optimization; quantify cyber business-interruption exposures; accelerate the closure of legacy claims; and improve workforce and fleet safety/loss control policies.
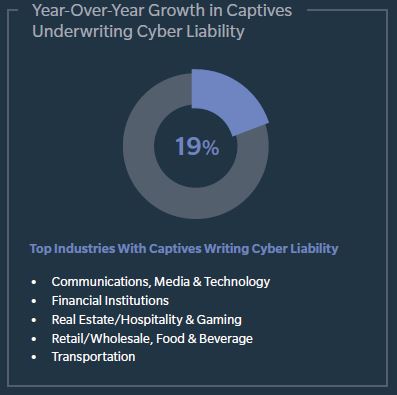
For example, Marsh-managed captives used to address cyber liability increased by 19% from 2015 to 2016. Since 2012, in fact, cyber liability programs in captives have skyrocketed 210%.
 “We expect to see a continued increase, driven in part by companies that are already strong captive users and by those that may have difficulty insuring their professional liability risks,” Marsh said.
