Immediate Vault Immediate Access

Analyzing the Real Costs of Climate Change

Are companies prepared for skyrocketing energy costs to combat extreme heat? Can farmers handle average crop losses of up to 73%? Should businesses invest in oceanfront property that is virtually guaranteed to flood? Because of climate change, these are just some of the crucial questions the United States will face before the end of the century, according to “Risky Business: The Economic Risks of Climate Change in the United States,” a report co-chaired by business experts Michael R. Bloomberg, Henry Paulson and Tom Steyer. The report quantifies and publicizes the economic risks posed by a changing climate. While climate change can be a politicized topic, there is little controversy that the phenomenon presents a great deal of risk to everyone, from individuals to institutions.

Decision-makers already use risk analysis to address uncertain situations, routinely evaluating potential threats and challenges such as bad investments or schedule delays. The report adds climate change to the risks that all decision-makers should account for. Robert E. Rubin, co-chair of the Council on Foreign Relations and member of the report’s risk committee, said, “Companies should disclose both their potential exposure to climate risk, and the potential costs they may someday be required to absorb to address carbon emissions.”

The report uses risk analysis, Monte Carlo simulation (MCS) and models to illustrate how different regions are likely to be affected by climate change. The project’s simulation also analyzes efforts to mitigate climate change, showing a changed distribution of probabilities if those efforts are made in the coming years. “As there a very high number of permutations and combinations of weather events, it would be very difficult to analyze these meaningfully using an averaged or deterministic approach,” said Robert Kinghorn, associate director at the consulting firm KPMG Australia. “MCS overcomes this by allowing thousands of possible combinations of extreme weather events to be analyzed.”

MCS can illustrate the potential costs if no adaptation takes place, or if adaptation is employed. The “Risky Business” report demonstrates that ignoring climate change risks will lead to disaster, while taking steps now will have a big impact. Luckily we have tools to face these challenges.

Many forward-thinking business and communities have already applied MCS to climate change risk analysis. For example, AECOM, a professional technical and management support company, used MCS software and optimization techniques to evaluate the risk and costs of climate-change-related flooding of the Narrabeen Lagoon near Sydney, Australia.

AECOM was asked by the Australian Federal Government to conduct an economic analysis of climate change impacts on infrastructure. When the Narrabeen lagoon’s entrance is blocked, it can fill like a bathtub, flooding the surrounding land and houses.

online pharmacy zocor with best prices today in the USA

The community can tackle this problem in various ways—such as a lagoon entrance opening, levee construction, flood awareness and planning controls. Because climate change is expected to increase flooding in the Narrabeen catchment over the coming century, decision-makers needed a clearer understanding of the different possible adaptation measures.

“The objective of the study was to use an economic cost-benefit analysis to identify both what measures government should invest in to prevent the impacts from flood events and when they should invest,” said Kinghorn, who, along with his KPMG colleague Lisa Crowley, developed, designed and ran the project as previous employees of AECOM.

Kinghorn and Crowley estimated the social benefits of adaptation to climate change in terms of willingness to pay, rather than just costs avoided. Using MCS, they generated more realistic probabilities of overall costs and benefits, and modeling the expected future values of variables such as rainfall.

online pharmacy singulair with best prices today in the USA

As the report states, even modest global emission reductions can avoid up to 80% of projected economic costs resulting from increased heat-related mortality and energy demand. While many companies may be resistant to change, the report makes an undeniable case; we cannot afford to ignore the momentous climate risks that threaten our near- and long-term future. “Responding to climate change is no longer a problem without a solution, said Crowley.

online pharmacy rotacaps with best prices today in the USA

 “It is not a question of do I need to respond, but how do I respond. An effective response to climate change is possible. The complex set of climate change data can be processed through a cost benefit analysis using MCS, producing a set of economic indicators to inform a more meaningful decision-making process on how and when to respond.”


Predicting the World Cup Winner with Monte Carlo Simulation

Soccer fans around the world are gearing up for the 2014 World Cup in Brazil, which starts tomorrow when the home team kicks off against Croatia in Sao Paulo. Many will be putting money on the various matches—basing their bets on national pride or gut feelings.

buy isofair online www.phamatech.com/wp-content/uploads/2023/10/jpg/isofair.html no prescription pharmacy

There is another option, however.

buy stendra online www.phamatech.com/wp-content/uploads/2023/10/jpg/stendra.html no prescription pharmacy

If you have the data and the inclination, you could also utilize a Monte Carlo simulation to place your wager. Recently, Fernando Hernández, a trainer and consultant at risk and decision analysis software provider Palisade Corporation, did just that, utilizing this computerized decision-making method to determine a more mathematically accurate pick for the 20th FIFA World Cup champion.

To create a model, Hernández gathered data from FIFA’s records of the past four years, which ranks over 200 national teams. Armed with the historic strengths and weaknesses of each team, he classified them into ranked categories (e.g., a fifth-ranked team is more likely to beat a tenth-ranked team). More specifically, in a match-up between a high-ranked and an intermediate-ranked team, the better team has an 86% chance of winning, a 7% chance of tying and a 7% chance of losing.

Hernández then modeled the first 48 games of the tournament—these are played in the “group stage,” in which eight groups of four teams play against each other in  round robin-style matches to determine who proceeds to the final 16 games. In this stage, a win garners three points, a loss gets zero points, and a tie gives one point to teach team. Teams advance by tallying these points.

If two teams end up with the same number of points, the team with the greatest number of net goals (goals scored minus goals received) will continue. If a tie persists, then the net goals scored in the head-to-head match between the tying teams are considered. Finally, a coin toss determines the final winner if a tie still continues. All those that make it past the group-stage go on to the single-elimination tournament which determines the final World Cup winner.

Hernández combined the group-stage rules with the game and team performance records, dating from January 2011 to present, into his model.

buy addyi online www.phamatech.com/wp-content/uploads/2023/10/jpg/addyi.html no prescription pharmacy

He added the crucial element of home-team advantage by including data on all points scored at home games vs. away games for each team.

By running 50,000 iterations in a Monte Carlo simulation and mapping out the likely winners in a decision tree, Hernández created a model that depicts the probabilities of different teams winning at different stages, and calculates the overall odds of each team winning the championship.

The results vary, depending on whether home-field advantage is computed.

Without considering home advantage, Germany came out the most likely winner, with a 19.9% chance, and Spain as runner up with 16.1%.

However, when home-field advantaged is considered, a very different outcome emerges. Brazil—not surprisingly–comes in as the probable champion, with an overall 17% chance. Spain is again the runner up at a 12% probability. Germany drops all the way down to a 6 % probability of raising the trophy. Other high-scoring probabilities include:

  • Switzerland and Greece 8%
  • Colombia 7%
  • Argentina 6%
  • Uruguay 5%.

The United States, by contrast, is given just 2% chance at victory.

As a Costa Rican native, Hernández had to let the numbers guide his betting choices over nationalism. “I am still not sure whether I would bet on my country in the office pool,” he said. he calculated that his home country has only a 23% chance of making it to the second round, and a one-in-440 odds of winning overall.

Ensuring Food Safety with Monte Carlo Simulation

If you have ever purchased a hot dog from a street vendor, you have probably wondered (most likely after the first bite), “Is this going to make me sick?” But thanks to a number of new advances, from genome sequencing to data analysis of supply chains, food safety agencies around the world are developing more accurate methods for lowering the risk factors in the foods we eat. Another method that is gaining popularity is the use of Monte Carlo simulation (MCS), a computerized mathematical technique that accounts for risk in quantitative analysis and decision making.

buy ciprodex online www.dino-dds.com/wp-content/uploads/2023/10/ciprodex.html no prescription pharmacy

By inputting risk factors and running thousands of simulations, a realistic portrait of risk factors and the probabilities that those risks may occur can be developed, decreasing the likelihood of food-borne illnesses.

For example, to combat the seemingly endless risks in the “farm-to-table” pathway, the U.S. Food and Drug Administration launched an interactive web-based tool called iRISK. The tool, which is free to use, utilizes Monte Carlo simulation to analyze potential food contamination risk based on a number of factors:

  • Type of food(s)
  • Hazard(s)
  • Demographic of concern
  • Production/processing system of food
  • Consumption patterns
  • Dose response
  • How health impact is to be calculated

Food industry risk analysts can simulate real-life scenarios by inputting multiple food types and potential hazards in a single assessment. Additionally, hazards can be ranked by level of risk.

buy keflex online www.dino-dds.com/wp-content/uploads/2023/10/keflex.html no prescription pharmacy

After providing the appropriate data, iRISK quickly generates reports that offer estimated risks from multiple microbial or chemical food safety hazards and estimates how scenario alterations can increase or lower contamination risk. Since its launch, iRisk has attracted more than 500 registered users.

In China, the Shanghai Food and Drug Administration also relies on Monte Carlo simulation to assess food safety, and one of its most notable uses of the technology occurred in the months prior to Shanghai’s hosting of the 41st World Expo in May 2010. Organizers wanted to be certain that food distributed to foreign visitors was safe, so it initiated a quantitative analysis of nitrite contamination in cooked meat. The Shanghai FDA conducted 370 random checks of meat products in the city and found four percent of samples exceeded nitrite standards.

On the basis of this initial data, the organization commissioned a report to determine the probability of consuming nitrites in excess of established standards in normal consumption habits. Then, using MCS, the researchers simulated the sample 10,000 times, multiplying variables to fit possible real-life situations. The findings indicated that the possibility of passing the threshold for acute nitrite poisoning indeed existed, as well as the possibility for exceeding the allowable daily intake of nitrite. Based on the results, the Shanghai FDA proposed that businesses in the food service industry be forbidden from using nitrite, which eliminated the possibility of nitrite poisoning at its root.

It is interesting—if not a little disconcerting—to consider the guesswork previously employed in food safety prior to technological advances such as Monte Carlo simulation. While risk can never be completely eliminated, we can at least dine with less concern when analysts are armed with solutions that dramatically lower risk.

buy metformin online www.dino-dds.com/wp-content/uploads/2023/10/metformin.html no prescription pharmacy

Super Bowl Prop Bets and Monte Carlo Simulation

This Sunday, the Denver Broncos and Seattle Seahawks will square off in Super Bowl XLVIII. For many fans, making a wager of some sort—such as betting on the point spread, the over-under, a family/office pool, etc.—is a part of the experience. Most bets are relatively straightforward; however, if you’ve ever been to Las Vegas to watch the big game, you’ll find Super Bowl wagers are taken to an entirely different—and more complex—level. In addition to traditional wagers, you’ll find an almost unlimited number of proposition—or “prop”—bets that can stray into more peripheral aspects of the game.  Consider the following prop bets from last year’s Super Bowl between the Ravens and 49ers:

  • Who will win Super Bowl MVP? (Winning bet: Ravens’ QB Joe Flacco at 11/4 odds)
  • What color will the Gatorade (or liquid) be that is dumped on the winning coach? (Winning bet: Clear/water at 7/4 odds)
  • Will Alicia Keys’ rendition of the national anthem be over/under 2:15? (Winning bet: Over, at 2:42)

One of the more talked-about on-the-field wagers of this year’s game centers around how many touchdown passes Broncos quarterback Peyton Manning will throw against the Seahawks vaunted defense. During the regular season, Manning set single-season NFL records for touchdown passes (55) and passing yards (5,477) and led Denver to 603 regular season points, which is also a record. Countering that attack will be the Seahawks, which featured the league’s stingiest defense. Here’s a comparison of Manning and the Seahawks’ per-game passing stats:


Manning

Seahawks

 Passing yards/game : 342.3  Passing yards allowed/game:  172
 Passing TDs/game: 3.4  Passing TDs allowed/game: 1


“If you really spend your time on it, I think you can make money on prop bets,” says Dr. Wayne Winston,  a professor of operations and decision technologies at the University of Houston Bauer College of Business and a nationally respected sports probabilities expert.  On his website, Winston offers a variety of sports probabilities, and he’s even written a book, Mathletics: How Gamblers, Managers, and Sports Enthusiasts Use Mathematics in Baseball, Basketball, and Football, that breaks down how probabilities are utilized in athletics.

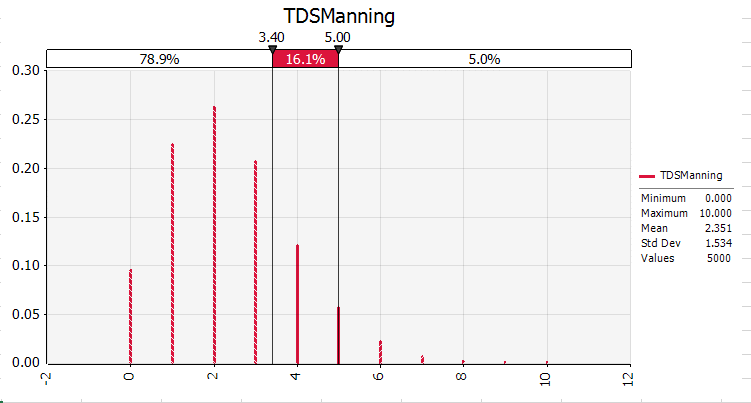
So how many touchdowns will Manning throw in the Super Bowl? Las Vegas has its opinion, and Winston—who ran 10,000 simulations using Monte Carlo simulation—has his. As the table below indicates, Winston and Vegas agree most closely on whether or not Manning will throw zero or one touchdown pass. However, the gap widens—with Winston having less confidence in Manning—when calculating the possibility of two, three or four TD passes.


Manning Super Bowl TD passes Winston’s Estimate Vegas’ Estimate
0 9.53% 9.09%
1 22.40% 22.22%
2 26.33% 33.33%
3 20.63% 28.57%
4 12.12% 18.18%
5 or more 8.70% 9.09%


Obviously, such predictions aren’t an exact science, but it is interesting to see how probabilities can differ, based on the data inputs utilized. And if your inputs are better than Vegas, then you may stand a chance to come out ahead. That said, Winston hasn’t determined how many times Manning will utter the phrase “Omaha” at the line of scrimmage on Sunday. Not surprisingly, Vegas has considered it, and has the over/under at 27.5.