Immediate Vault Immediate Access

October 2015 the Warmest Ever Recorded

It isn’t just your imagination: October 2015 was the warmest on record worldwide, and saw the greatest above-average deviation for any month. According to the National Oceanic and Atmospheric Administration, the average temperature across global land and ocean surfaces was 1.

buy zantac online healthymomsandbabes.org/wp-content/uploads/2023/10/jpg/zantac.html no prescription pharmacy

76 °F above the 20th century average, surpassing the previous record set last year by 0.36 °F. The globally-averaged land surface temperature was 2.39°F above the 20th century average—the highest for October in 136 years of NOAA records.

buy mobic online healthymomsandbabes.org/wp-content/uploads/2023/10/jpg/mobic.html no prescription pharmacy

NOAA land and ocean temp percentiles

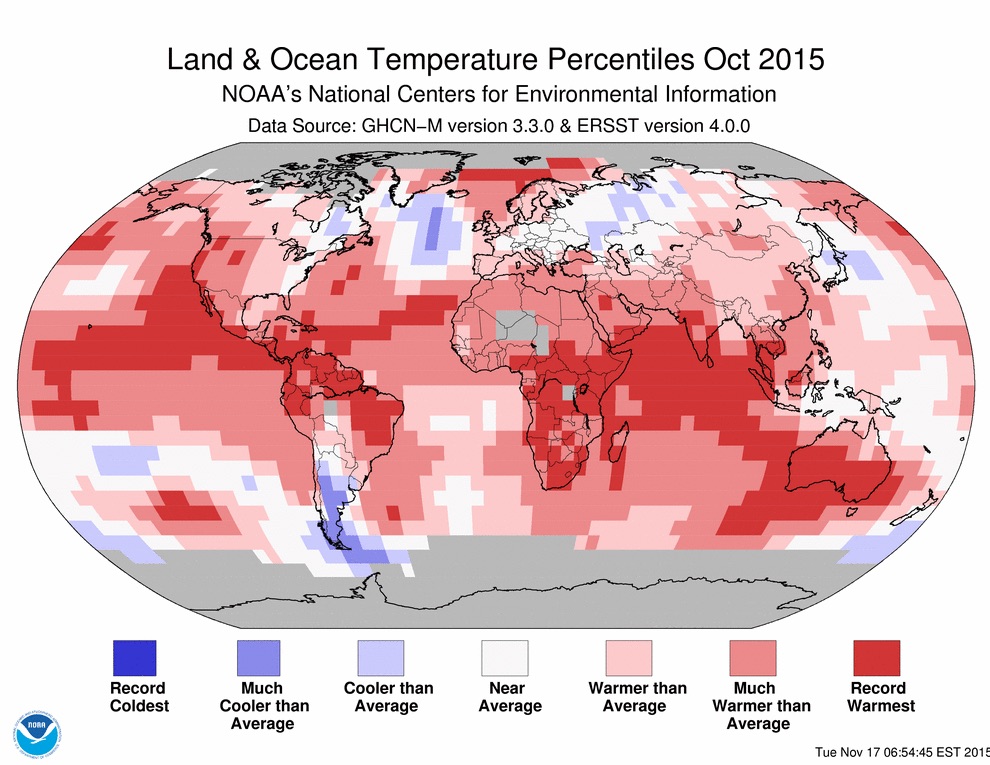
October was also the warmest month ever compared to average, out of a total of 1,630 months. What’s more, NOAA reports, eight of the first 10 months of the year have been record warm for their respective months—also a record number of broken records. Globally-averaged land surface and sea surface temperatures have been 1.55 °F and 2.30 °F above average, respectively, surpassing all previous records. With many months setting record high temperatures by unprecedented margins, NOAA said in August that there was a 97% chance that 2015 would secure the title of the warmest year on record, and it remains solidly on track.

In early November, the Met Office, Britain’s national weather service, and NASA both reported that the Earth’s average temperature is likely to rise 1 °C above pre-industrial levels for the first time by the end of 2015. This milestone is significant since it marks the halfway point to two degrees Celsius, the internationally accepted limit for avoiding the worst consequences of climate change, the Washington Post reported. Since 2000, global monthly heat records have been broken 32 times, yet the last time a monthly cold record was set was in 1916, according to CBS News.

Some of the heat is likely due to a strong El Nino event in the Eastern Pacific that continues to gather strength.

buy zocor online healthymomsandbabes.org/wp-content/uploads/2023/10/jpg/zocor.html no prescription pharmacy

This year’s El Nino is already one of the three strongest ever seen, CNN reports, but cannot account for all of the year’s warmth, as 13 of the 15 warmest years on record have occurred since 2000. Rather, it is the combination of long-term warming and the strong El Nino pushing Earth toward its second consecutive warmest year on record.

According to Aon Benfield’s October 2015 Catastrophe Report, there were three billion-dollar weather-related disasters in October: flooding in South Carolina with economic losses of at least $2 billion, $4.2 billion in damage from Typhoon Mujigae in China, and $1 billion in damage from flash flooding in France. The firm estimates worldwide economic losses from October to total more than $10 billion. There have been 21 billion-dollar weather events through October 2015, Aon reported, on pace for a lower total than the annual average of 28.

Check out the infographic below for more of the major climate anomalies and events from October 2015:

NOAA october climate anomalies

FM Global Teaches Explosive Safety Lessons

FM Global Fire Hazard Lab

This week, I ventured up to West Glocester, Rhode Island, home of the coolest place any insurance broker, insurance client, or risk management journalist can visit: the FM Global Research Campus.

Hurricane Force Wind Simulation

Because FM Global is intently focused on prevention of loss as the chief means of minimizing claims, the company maintains a 1,600-acre campus dedicated to property loss prevention scientific research. The biggest center of its kind, the research center features some of the most advanced technology to conduct research on fire, natural hazards, electrical hazards, and hydraulics. Here, experts can recreate clients’ warehouse conditions to test whether existing suppression practices would be sufficient in the event of a massive fire, for example.
buy symbicort online https://royalcitydrugs.com/symbicort.html no prescription

Fabricated hail or seven-foot 2x4s are shot from a cannon-like instrument at plywood, windows, or roofing to test whether these materials can withstand debris that goes flying in hurricane-strength winds. Hydraulic, mechanical and environmental tests are conducted on components of fire protection systems, like sprinklers, to ensure effectiveness overall and under the specific conditions clients face. Further, in cases where there were not sufficient loss prevention solutions, the company’s scientists and engineers have even designed and patented new, more effective sprinklers and other loss prevention technology, the rights to which are released so anyone can manufacture these improved safety measures.

Fire is the leading cause of loss in every calendar year, and watching a pile of plastic pallets ignite into a 60-foot fire while you feel the radiant heat through the glass of the lab’s observation deck is a powerful reality check for anyone evaluating risk exposure in their facility. As you watch the pallets melt, forming a plastic pool that also catches fire and spreads, you see the fire double in size every 45 seconds. If your strategy is primarily to rely on the local fire station, the researchers note, a minimal response time, assuming decent proximity, no traffic or inclement weather, and full staffing, would probably be at least five to 10 minutes. It only took seven minutes for their sample fire to reach almost three stories high, flickering around the edges of the massive ceiling-mounted calorimeter (which measures heat and the particles and smoke released).

buy celexa online pelmeds.com/wp-content/uploads/2023/10/jpg/celexa.html no prescription pharmacy

One of the most striking demonstrations comes in the form of a dust explosion. Whether released through product manufacturing, a byproduct of processing, or simply lazy housekeeping, a wide variety of dusts can fill the air in many facilities. Flour, sugar, metal dust, wood and resin are all highly flammable and exceptionally common.

buy singulair online pelmeds.com/wp-content/uploads/2023/10/jpg/singulair.html no prescription pharmacy

To cause an explosion, you simply need a few conditions: fuel (the dust), oxygen, ignition, suspension (in other words, the dust has not settled, increasing the surface area), and a confined space (ie. inside the facility, the dust stays in the environment). What happens then? Check out the video below for a slow-motion look at the explosion that results from just a hard hat full of phenolic resin.

Can Your Organization Survive a Natural Disaster?

In the wake of a natural disaster, about a quarter of businesses never reopen.

buy desyrel online blackmenheal.org/wp-content/uploads/2023/10/jpg/desyrel.html no prescription pharmacy

Whether due to primary concerns like a warehouse flooding, secondary complications like supply chain disruption, or indirect consequences like transportation shutdown that prevents employees from getting to work, there are a broad range of risks that can severely impact any business in the wake of a catastrophe that must be planned for.

Planning and securing against natural disaster risks can be daunting and exceptionally expensive, but researchers have found that every dollar invested in preparedness can prevent of disaster-related economic losses.

Check out more of the questions to ask and ways to mitigate the risk of natural disasters for your organization with this infographic from Boston University’s Metropolitan College Graduate Programs in Management:

Survive a Natural Disaster

Tool Calculates Natural Hazard Risk to Property

Potential for hurricanes and storm surges, the possibilities of wildfires and sinkholes, and an extensive coastline make Florida rank as the state with the highest risk of property damage from natural hazards, according to a new analysis by CoreLogic. Second on the list is Rhode Island, with Michigan coming in with the lowest ranking for risk.

The analysis was derived from the Hazard Risk Score (HRS), a new analytics tool that gathers data on multiple natural hazard risks and combines the data into a single score ranging from 0 to 100. The score indicates risk exposure at the individual property and location level, CoreLogic said. In calculating an overall score, the probability of an event and the frequency of past events are significant contributing factors to determine risk levels associated with individual hazards, along with each hazard’s risk contribution to total loss.

“Florida’s high level of risk is driven by the potential for hurricane winds and storm surge damage along its extensive Atlantic and Gulf coastline, as well as the added potential for sinkholes, flooding and wildfires. Michigan alternatively ranks low for most natural hazard risks, other than flooding,” Howard Botts, Ph.D., vice president and chief scientist for CoreLogic Spatial Solutions, said in a statement.

HRS measures risk concentration and pinpoints the riskiest places in the country. “This insight is critical in conducting comparative risk management nationwide and fully understanding exposure to potential natural hazard damage,” Botts said.

The tool can be used to improve decision-making and enhance business operations, including:

• Business continuity and disaster recovery planning

• Analyzing risks associated with properties

• Measuring savings of mitigation compared to the potential damage of a hazard

• Evaluating natural hazard levels of distribution and supplier networks

• Recognizing if underinsured or uninsured properties could be at risk of default

• Adverse selection avoidance and identification of good risk properties.