Immediate Vault Immediate Access

Coastal High Tide Flooding Escalates, NOAA Reports

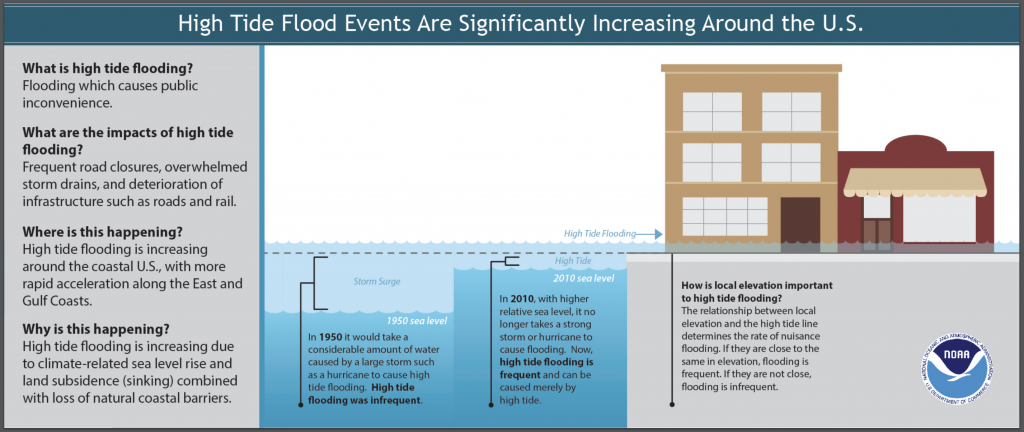
According to the third U.S. National Climate Assessment, “Global climate is changing and this is apparent across the United States in a wide range of observations.” Rising temperatures leading to increasingly high sea levels have changed coastal flood patterns, leading to more frequent high tide flooding, the National Centers for Environmental Information (NOAA) said in its National Climate Report’s 2018 Outlook of coastal flooding.

“As a whole, high tide flood frequencies during 2018 are predicted to be about 60% higher (median value) across U.

buy finasteride online cosmeticdermcenter.com/wp-content/uploads/2023/10/jpg/finasteride.html no prescription pharmacy

S. coastlines as compared to trend values at the start of this century (i.e., year 2000),” NOAA said.
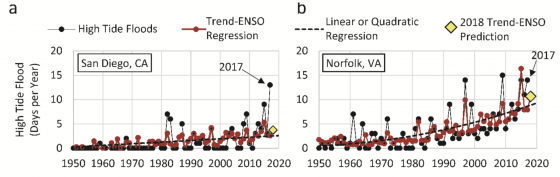
More than one quarter (27) of the 98 U.S. coastal locations examined tied or broke their individual records for high tide flooding in 2017. The NOAA report found that the Southeast Atlantic coast is now experiencing the fastest rate of increase in annual high tide flood days, with more than a 150% increase since 2000 predicted in 2018 at most locations.

The top five cities that broke records with the highest number of flood days across the United States were: Boston, Massachusetts; Atlantic City, New Jersey; Sandy Hook, New Jersey; Sabine Pass, Texas; and Galveston, Texas. “These cities faced the brunt of an active nor’easter and hurricane seasons and sea level rise, which has made these and other less extreme events more impactful,” NOAA said.

buy mobic online cosmeticdermcenter.com/wp-content/uploads/2023/10/jpg/mobic.html no prescription pharmacy

According to NOAA:

  1. During the 2017 meteorological year (May 2017-April 2018), the U.S. average number of high tide flooding days was the highest measured at 98 NOAA tide gauges. More than a quarter of the coastal locations tied or broke their individual records for high tide flood days.
  2. Water reached a flooding threshold at NOAA tide gauges a record-breaking number of times in the Northeast and the Gulf of Mexico due to a combination of active nor’easter and hurricane seasons combined with sea level rise, making these events more impactful.
  3. The projected increase in high tide flooding in 2018 may be as much as 60% higher across U.S. coastlines as compared to typical flooding about 20 years ago and 100% higher than 30 years ago. This is due to long-term sea level rise trends and, in part, by El Nino conditions that may develop later this year.
    buy tamiflu online cosmeticdermcenter.com/wp-content/uploads/2023/10/jpg/tamiflu.html no prescription pharmacy

Flood, Wind Dominant Natural Hazards in 2016

While most natural hazards occurring in the United States last year saw average or below average activity, the exceptions were flood and wind, according to the CoreLogic report Natural Hazard Risk Summary and Analysis, released today.

Severe flood events driven by substantial rainfall were the dominant natural hazards, with Louisiana and North Carolina floods being the major loss contributors. As in 2015, hurricanes and tropical storms in 2016 continued to cause inland flooding through increased and intense rainfall—even when not making landfall, according to the report.

The National Oceanic and Atmospheric Administration (NOAA) said there were 12 individual weather and climate disaster events in the U.S. with losses exceeding $1 billion in 2016.

According to the report:

  • Based on NOAA and CoreLogic analysis, the overall flood loss in 2016, driven by six, 1,000-year plus rain events, was approximately $17 billion, which is six times greater than the overall flood damage experienced in 2015.
  • The U.S. Geological Survey (USGS) recorded 943 earthquakes of magnitude 3.0 or greater in 2016, with more than 60 percent of these earthquakes located in Oklahoma.
  • The National Interagency Fire Center (NIFC) reported a total of 5,415,121 acres burned from 62,864 separate fires in 2016.
    buy arimidex online achievephysiorehab.ca/wp-content/uploads/2023/10/jpg/arimidex.html no prescription pharmacy

    While the total acres burned in 2016 fell below the 10-year average, significant losses occurred, with thousands of homes in California and Tennessee destroyed by several smaller fires that burned in populated areas.

  • Wind activity in 2016 was slightly above average, due in large part to strong winds brought by Hurricane Matthew.
    buy mobic online achievephysiorehab.ca/wp-content/uploads/2023/10/jpg/mobic.html no prescription pharmacy

  • Hail activity in 2016 was near the average, and Texas experienced the worst of this natural hazard.
  • Tornado activity in 2016 was near average compared with previous years.
  • Hurricane Matthew developed late in the year and grew to a Category 5 storm, resulting in substantial damage along the southeastern seaboard.
  • There were below-average levels of tropical cyclone activity in the western North Pacific Basin encompassing East and Southeast Asia in 2016.

However, 2016 became known as the year without a winter. Nine winter storms impacted the U.S. in 2016, the most notable being the late-January winter storm in New York.

“History has continually shown us that it is impossible to determine exactly when or where the next wildfire, flood or earthquake will strike, which is why preparedness, response and post-loss assessment are paramount,” CoreLogic said.

Anticipating Hurricane Matthew, 4 States Declare Emergency

matthew-map
Rebounding to Category 4 hurricane classification, Matthew now has winds up to 140 miles per hour and has caused at least 28 deaths in three Caribbean countries. It is heading for the southeastern U.S., where four states—Florida, Georgia, South Carolina and North Carolina—have issued a state of emergency and evacuation orders in coastal regions.

Matthew was a Category 4 hurricane through Tuesday, was downgraded to a Category 3 early on Wednesday, and has now returned to Category 4 strength today, according to the U.S. National Hurricane Center (NHC).

Florida Gov. Rick Scott issued a warning on Thursday urging those in evacuation zones to leave immediately. “Based on the current forecast, the heights of storm surge will be above ground. Waves will be crashing on roofs. Homes will be destroyed,” he tweeted in both English and Spanish on Thursday morning.

“Time is up, Hurricane Matthew is approaching Florida. If you are in an evacuation zone, leave now,” he said in a statement. “To everyone on Florida’s east coast, if you are reluctant to evacuate, just think of all the people the hurricane has already killed.  You and your family could be among these numbers if you don’t take this seriously.”

Scott said that so far more than 4,000 National Guard members have been activated to help with evacuations and sheltering. He tweeted that as of 6:00 a.m., more than 3,000 people were in about 60 shelters. The state offers a mobile app to help those in flood-prone areas find the nearest shelter and also avoid traffic congestion.

A state of emergency has been declared by Georgia’s governor for 13 coastal counties. South Carolina’s governor declared a state of emergency and has begun coastal evacuations that may affect up to 1 million people. Because of heavy traffic, lane reversals on some highways are in effect, and schools and government offices in 25 South Carolina counties are closed today. North Carolina’s governor has declared a state of emergency for more than 50 counties and issued a mandatory evacuation order for Ocracoke Island, AIR Worldwide reported.

The Federal Emergency Management Agency (FEMA) has sent personnel and supplies to all four states, and President Obama is meeting with FEMA officials coordinating the response to Hurricane Matthew at the agency’s headquarters in Washington, D.C.

According to CoreLogic, a Category 3 storm hitting Miami could potentially damage 176,000 homes at a reconstruction cost value (RCV) of about $3.8 billion.

CoreLogic’s Storm Surge Risk Report estimates that more than 6.8 million homes located along the Gulf and Atlantic coasts are at risk of storm surge damage, with a total RCV of about $1.5 trillion.The length of coastline, coastal elevation and density of residential development all contribute to the risk of storm surge flooding.
core-logic-1

According to CoreLogic, the total number and total value of residential properties for the four states currently bracing for Hurricane Matthew are:

Total Number and Total Value of Residential Properties by State

America’s Safest Driving Cities

Winter weather has yet to appear in many parts of the country, but it’s on its way. When factoring rainy or snowy conditions into collision frequency, however, some cities are safer than others in many types of weather, according to the 2015 Allstate America’s Best Drivers Report.

driversWhile there are many factors that impact highway safety, an improving economy and lower gas prices have led to an increase in the number of miles being driven.

online pharmacy finasteride with best prices today in the USA

According to the Federal Highway Administration’s latest Traffic Volume Trend Report, cumulative travel for 2015 is up by 3.

online pharmacy valtrex with best prices today in the USA

5%. The September report is based on hourly traffic count data reported by the states, using data collected at about 4,000 continuous traffic counting locations nationwide.

Recently, the National Safety Council estimated that the U.S. is on track for its deadliest driving year since 2007. In the first six months of 2015, NSC reported traffic deaths were up 14% from a year ago, and serious injuries were 30% higher over the same period.

The city with the best driving report this year is Kansas City, Kansas. Factoring in precipitation, Cape Coral, Fla., and Brownsville, Tex., came in second and third, respectively. Cities at the bottom of the list of 200 were Boston, Massachusetts; Worcester, Massachusetts; and Baltimore, Maryland. New York City was listed at 151.

The report is based on Allstate’s claims data, ranking America’s 200 largest cities in terms of car collision frequency to identify which have the safest drivers. The data also shows how these cities rank when precipitation is a factor. The rankings are based on the expected driver performance given each city’s average annual precipitation as measured by NOAA, according to Allstate.

America’s safest driving cities:

ABD-Infographic-2015-1