Immediate Vault Immediate Access

California’s New Localized Water Controls a Step Forward

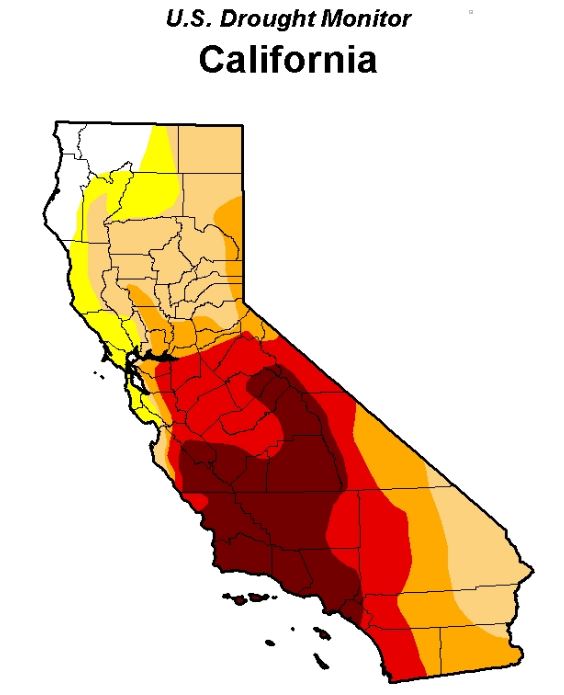
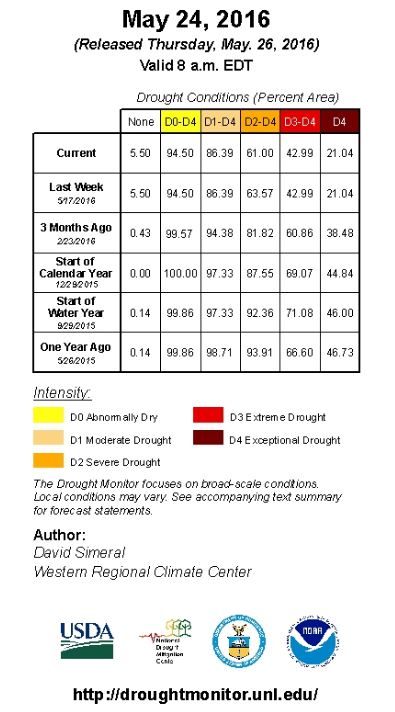
With higher levels of rain and snowfall over the winter, California’s water situation has eased in some areas, prompting the state to initiate new water conservation rules, adopted on May 18 and in effect June 1 through January 2017. The regulations give control over water usage to local communities, which means more restrictions in some areas than in others. In Northern California, winter precipitation has filled some reservoirs, while drought conditions persist in Southern California.

The previous rule—enacted in April 2015 by Gov. Jerry Brown, who issued an Executive Order mandating a 25% reduction of urban water usage from 2013 levels over a nine-month period—saw a savings of about 424 billion gallons. That followed a failed year-long effort to achieve a voluntary 20% reduction in water usage, with statewide conservation results averaging between just 7% and 12%.

The State Water Resources Control Board explained that the new approach replaces the percentage reduction-based water conservation standard with a localized approach. The emergency regulation requires that urban water suppliers ensure that at least a three year supply of water would be available to their customers in case of drought conditions. Suppliers that would face shortages under three additional dry years are now required to meet a conservation standard equal to the amount of a shortage. A water agency that projects it would have a 10% supply shortfall, for example, would have a mandatory conservation standard of 10%. The regulation also makes previously passed water-wasting rules permanent, including no hosing of sidewalks, washing cars without a hose nozzle, or watering lawns within 48 hours of measurable rainfall.

“El Nino didn’t save us, but this winter gave us some relief,” Water Board Chair Felicia Marcus said in a statement. “It’s a reprieve though, not a hall pass, for much if not all of California. We need to keep conserving, and work on more efficient practices, like keeping lawns on a water diet or transitioning away from them. We don’t want to cry wolf, but we can’t put our heads in the sand either.”

Will Sarni, director and practice leader of water strategy at Deloitte, agrees with the direction the state is taking on conservation.

While it may appear that restrictions are being eased, which could send the message that things are going back to business as usual, “It’s not business as usual, but local entities are being given more control,” Sarni said. “My view is that water is ultimately a local issue, so providing greater flexibility and decision-making at the local level that aligns with an overall strategy within the state, or nation, makes sense.”

The model of local management actions that roll up to a regional entity have successfully been adopted in other parts of the country, he said, explaining that states do work together. One example is the Delaware River Basin Commission, which is an entity that has a say in how water is managed in the Delaware River. Other examples include the Great Lakes Commission and the Colorado River Compact. “So cooperating on water is actually more common than not,” Sarni said.
Drought1

Drought 2

Massive Wildfires Ravage Alberta, Canada

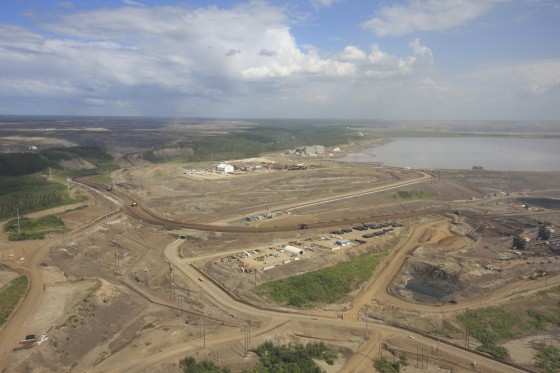
oil sands, Canada
Wildfires have shut down tar sand operations north of Fort McMurray, Alberta, Canada

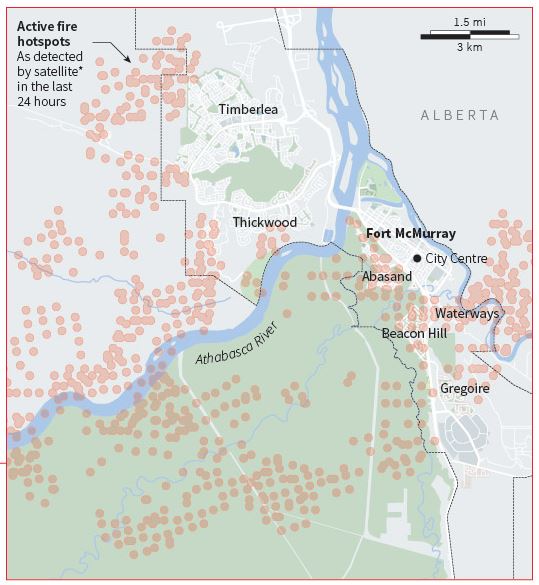
Drought conditions in 2015 left Alberta, Canada, parched. Combined with recent winds and high temperatures, this has led to a massive, intense wildfire in the oil city of Fort McMurray, forcing evacuation of more than 80,000 people, and burning about 1,500 homes. Authorities said there have been no known casualties from the blaze, but that fatalities were reported in at least one vehicle crash along the evacuation route.

On Tuesday, the municipality of Wood Buffalo announced mandatory evacuations and closed all southbound routes. Residents fled to safer ground north of the of the area, where they spent Wednesday night in arenas, hockey rinks and oil work camps that often ran short of supplies, Reuters reports.

The fire is now five times its initial size and spreading south, taking it farther away from the massive tar sands area. Shell Nexen, Suncor and other oil sands operators have curtailed or shut down operations to protect pipelines and help evacuate employees and nearby residents, according to the Washington Post.

The wildfires in Canada illustrate a continuing trend of increasingly severe wildfires that in the United States caused a record 10.

buy rifadin online www.delineation.ca/wp-content/uploads/2023/10/jpg/rifadin.html no prescription pharmacy

1 million acres to be burned in 2015, surpassing the previous high of 9.

buy periactin online www.delineation.ca/wp-content/uploads/2023/10/jpg/periactin.html no prescription pharmacy

8 million acres in 2006, Mark Crawford reported in last month’s issue of Risk Management. It was the fourth year in the past decade in which more than nine million acres burned. According to the U.S. Forest Service, the 2015 wildfire season was the costliest on record, with more than billion spent fighting fires.

buy zantac online www.delineation.ca/wp-content/uploads/2023/10/jpg/zantac.html no prescription pharmacy

Environmental scientists at the Harvard School of Engineering and Applied Sciences said in 2013 that rising temperatures could lengthen wildfire seasons, increasing burn areas and smoke from fires.

Meanwhile, current weather reports for Alberta have raised hopes, as the forecast calls for cooler temperatures and possible rain.

Alberta hotspots

Building Resilience, City by City

Highline park

With escalating risks and uncertainty around the globe, cities are challenged with understanding and circumventing those risks to stay vital. Much as in the business world, municipalities are moving towards resilience—the capability to survive, adapt and grow no matter what types of stresses are experienced.

Recognizing that they have much to offer each other, communities and businesses are often working together to pool their experience and knowledge. Helping to foster this is a project called the 100 Resilient Cities Challenge, funded by the Rockefeller Foundation. The project has selected 100 cities around the world and provided funding for them to hire a chief resilience officer.

“Resilience is a study of complex systems,” said Charles Rath, president and CEO of Resilient Solutons 21. He spoke about resilience and his experiences with the 100 Resilient Cities Challenge at the recent forum, “Pathways to Resilience,” hosted by the American Security Project and Lloyd’s in Washington, D.C. “To me, resilience is a mechanism that allows us to look at our cities, communities, governments and businesses almost as living organisms—economic systems that are connected to social systems, that are connected to environmental systems and fiscal systems. One area we need to work on is understanding those connections and how these systems work.”Green space

Rath said that cities that have successfully implemented innovative resilient solutions have been able to “identify and communicate co-benefits. If you do some research around those jurisdictions that received funding, you’ll see interesting strategies that address their risks, but also have added economic, social and other co-benefits.”

Examples were evident after Hurricane Katrina and Superstorm Sandy. “Those communities that were able to bounce back quickest were those that had strong, socially cohesive societies. We also know that social cohesion drives economic activities in urban areas as well,” he said.

One of the first projects he worked on for the Resilient Cities Challenge was with the city of El Paso. “It is in the southwest and excessive heat is an issue they are dealing with,” he explained. “They have many parts of the city that see significant spikes in temperature, which leads to asthma, increased cooling costs and the list goes on. It’s projected over the next 70 or so years to increase 7 to 10 degrees, so it’s a big problem.”

To address the issue, he researched the issue and met with El Paso’s city manager. “We were able to pinpoint all of the different areas in El Paso where there is heat island effect,” he said. “We could tell what degree it was and roughly what was causing it.”

Causes for the escalating heat proved to be a lack of reflectivity, impermeable surfaces and lack of green space. “But it was at the point where we told him that he was costing the city about $150 million a year in increased cooling costs—because we were able to isolate the building outlines in the downtown area—that he began to pay attention,” he said. “Then we also showed him areas of the city where there was increased heat island effect where there was a significant amount of concrete. There were also a large percentage of children in the area who didn’t have access to parks.”

A solution for both dilemmas could be achieved by “transforming those vacant lots to pocket parks so that kids could have access to playgrounds.” he said, adding, “Those types of solutions with multiple co-benefits are an important element of what we are doing and this encouraged us to explore that.”

October 2015 the Warmest Ever Recorded

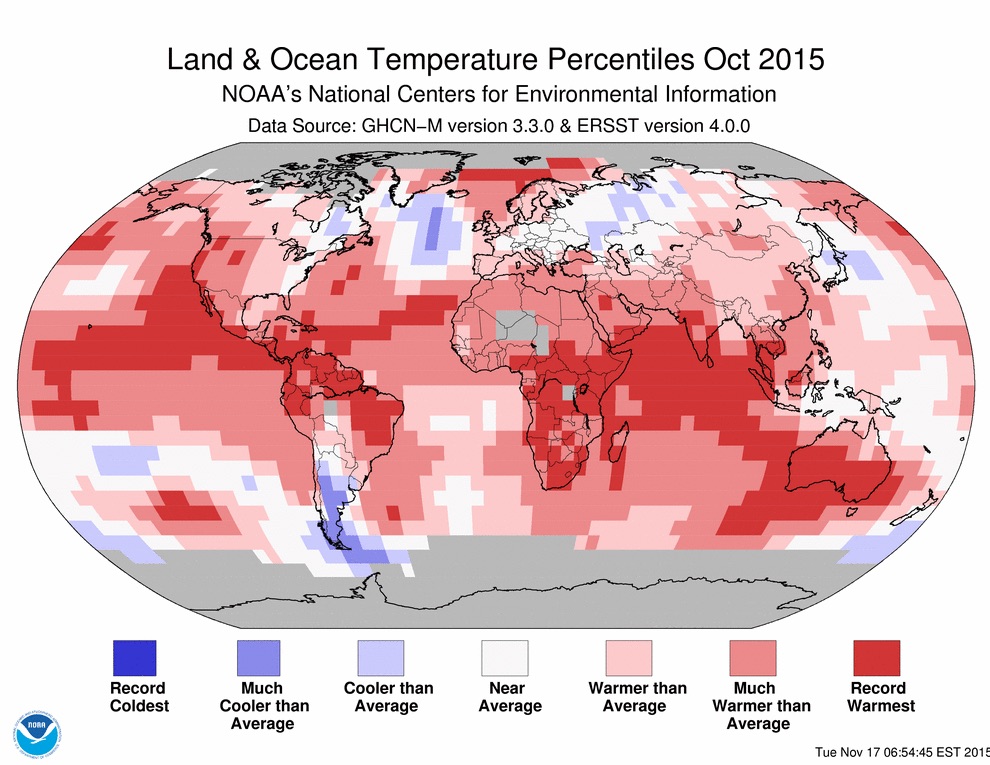
It isn’t just your imagination: October 2015 was the warmest on record worldwide, and saw the greatest above-average deviation for any month. According to the National Oceanic and Atmospheric Administration, the average temperature across global land and ocean surfaces was 1.

buy zantac online healthymomsandbabes.org/wp-content/uploads/2023/10/jpg/zantac.html no prescription pharmacy

76 °F above the 20th century average, surpassing the previous record set last year by 0.36 °F. The globally-averaged land surface temperature was 2.39°F above the 20th century average—the highest for October in 136 years of NOAA records.

buy mobic online healthymomsandbabes.org/wp-content/uploads/2023/10/jpg/mobic.html no prescription pharmacy

NOAA land and ocean temp percentiles

October was also the warmest month ever compared to average, out of a total of 1,630 months. What’s more, NOAA reports, eight of the first 10 months of the year have been record warm for their respective months—also a record number of broken records. Globally-averaged land surface and sea surface temperatures have been 1.55 °F and 2.30 °F above average, respectively, surpassing all previous records. With many months setting record high temperatures by unprecedented margins, NOAA said in August that there was a 97% chance that 2015 would secure the title of the warmest year on record, and it remains solidly on track.

In early November, the Met Office, Britain’s national weather service, and NASA both reported that the Earth’s average temperature is likely to rise 1 °C above pre-industrial levels for the first time by the end of 2015. This milestone is significant since it marks the halfway point to two degrees Celsius, the internationally accepted limit for avoiding the worst consequences of climate change, the Washington Post reported. Since 2000, global monthly heat records have been broken 32 times, yet the last time a monthly cold record was set was in 1916, according to CBS News.

Some of the heat is likely due to a strong El Nino event in the Eastern Pacific that continues to gather strength.

buy zocor online healthymomsandbabes.org/wp-content/uploads/2023/10/jpg/zocor.html no prescription pharmacy

This year’s El Nino is already one of the three strongest ever seen, CNN reports, but cannot account for all of the year’s warmth, as 13 of the 15 warmest years on record have occurred since 2000. Rather, it is the combination of long-term warming and the strong El Nino pushing Earth toward its second consecutive warmest year on record.

According to Aon Benfield’s October 2015 Catastrophe Report, there were three billion-dollar weather-related disasters in October: flooding in South Carolina with economic losses of at least $2 billion, $4.2 billion in damage from Typhoon Mujigae in China, and $1 billion in damage from flash flooding in France. The firm estimates worldwide economic losses from October to total more than $10 billion. There have been 21 billion-dollar weather events through October 2015, Aon reported, on pace for a lower total than the annual average of 28.

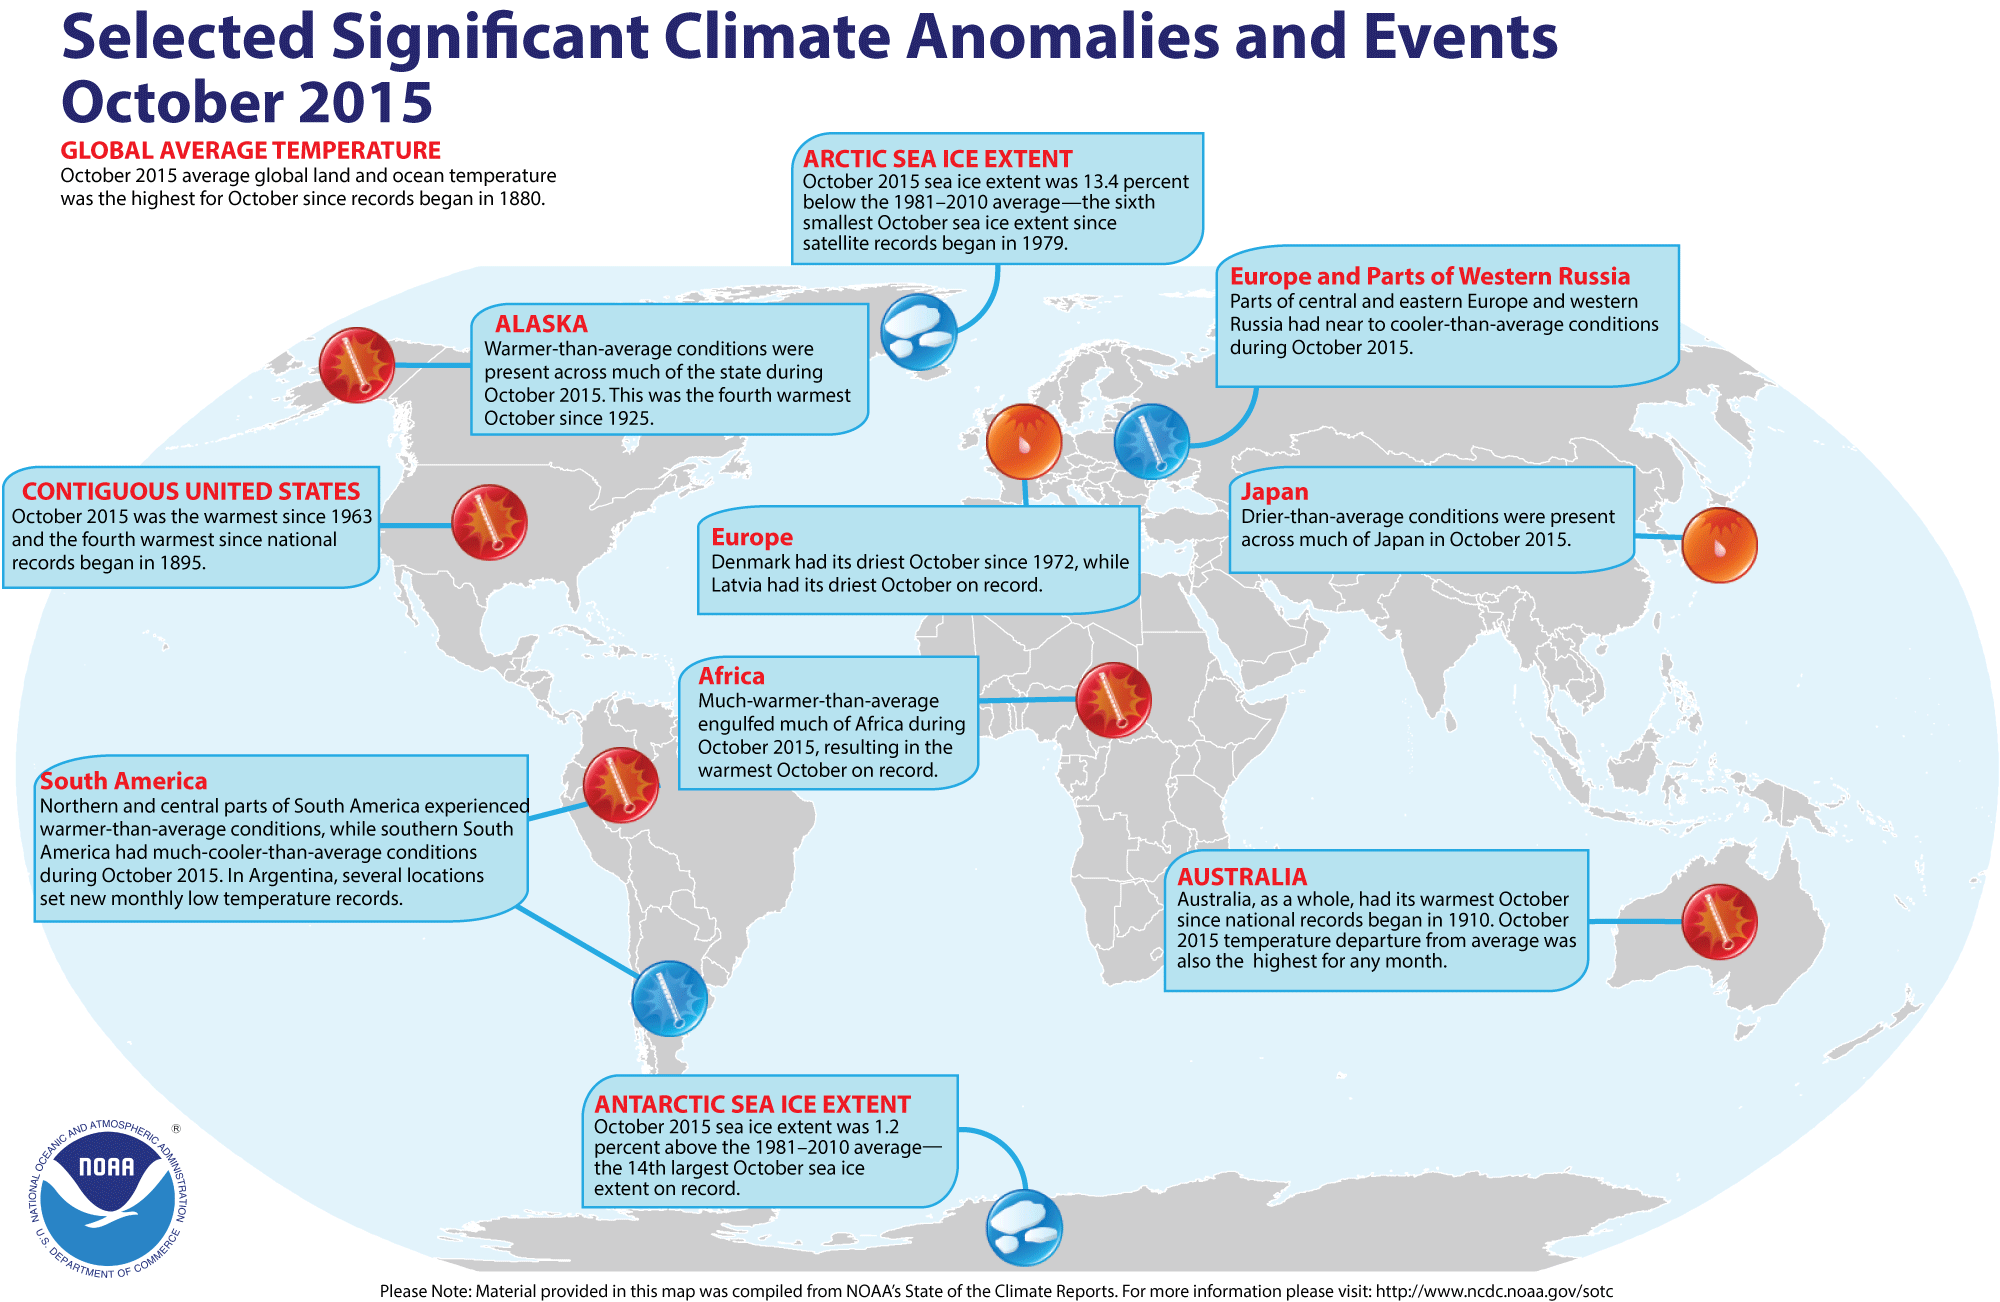
Check out the infographic below for more of the major climate anomalies and events from October 2015:

NOAA october climate anomalies