Immediate Vault Immediate Access

Deer Collisions Drop Slightly, But Accident Costs Still Rise

With fall in full swing and holidays on the horizon, new information about animal collisions on the road have been made available for employers and employees.

State Farm’s 16th annual deer-vehicle collision study indicates that overall in the U.S., drivers had a 1-in-167 chance of having a crash with a deer, elk, moose or caribou.

buy singulair online rxbio.com/images/milestones/jpg/singulair.html no prescription pharmacy

This is a five-point drop from last year when the national odds were 1-in-162.

What’s more, State Farm reports that the national per claim average rose for the second year in a row to $4,341 from $4,179 during 2016-17.

The chance of hitting a deer, or another large animal, doubles in the fall. The months with the most claims are November, October and December, in that order.
buy flagyl online https://galenapharm.com/pharmacy/flagyl.html no prescription

Some tips for avoiding animal crashes include:

  • Slow down, particularly at dusk and dawn.
  • If you see one deer, be prepared for more deer to cross the road.
  • Brake if you can, but avoid swerving.
    buy amoxil online rxbio.com/images/milestones/jpg/amoxil.html no prescription pharmacy

    This can result in a more severe crash.

  • Avoid distractions. Devices or eating might cause you to miss seeing an animal.
  • Do not rely on products such as deer whistles. They are not proven effective.

Additional Autumn Road Hazards

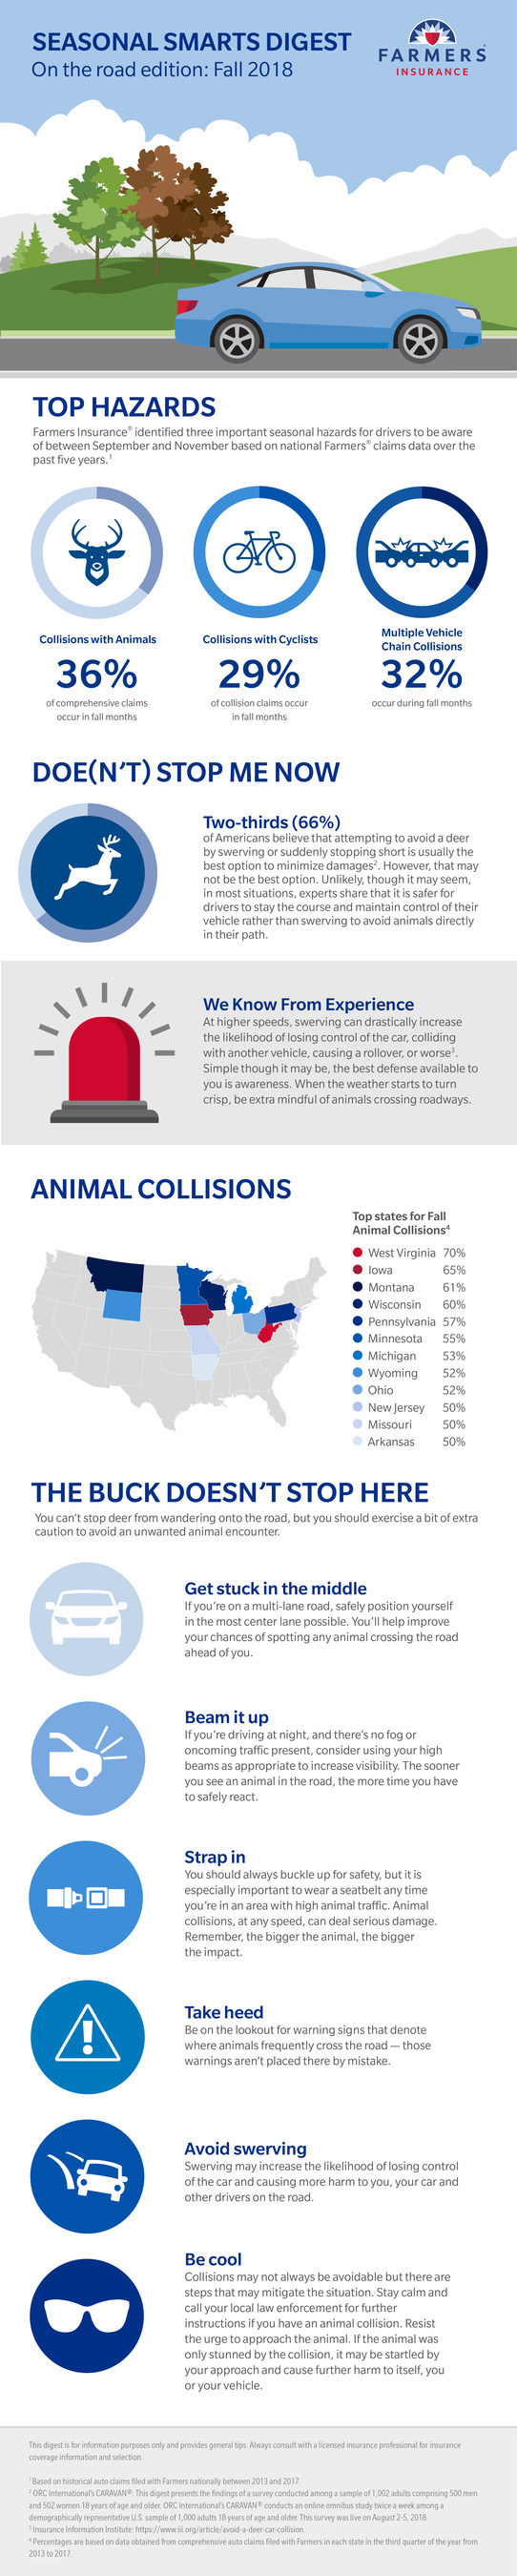
The modest drop in deer collisions doesn’t mean the risk isn’t still prevalent. In its Fall 2018 Seasonal Smarts Digest, Farmers Insurance identified collisions with animals as the top seasonal hazard for drivers between September and November over a five-year period. Collisions with cyclists and multiple vehicle chain collisions followed closely behind as the top types during fall months.

“If you do find yourself in a situation involving a potential collision with deer or other animals this fall, try to stay the course,” said Jim Taylor, head of claims customer experience for Farmers Insurance. “Believe it or not, it may be safer for you and other vehicles on the road to remain calm and stay the course rather than swerving at high speeds in an attempt to avoid the animal.

buy zydena online rxbio.com/images/milestones/jpg/zydena.html no prescription pharmacy

The Most Dangerous Month For Drivers Has Begun

Now that August has arrived, warnings are being posted—the United States has entered its deadliest month for drivers, according to the Insurance Institute for Highway Safety (IIHS). IIHS information revealed that 505 fatalities have been reported on Aug. 2 every year between 2012 and 2016—the most recent studied—making it the most fatal day for drivers in that time frame.

buy arava online www.gcbhllc.org/scripts/html/arava.html no prescription pharmacy

During the same five-year span, July 4 had the second-highest number of traffic fatalities with 495.

buy sildalis online www.gcbhllc.org/scripts/html/sildalis.html no prescription pharmacy

IIHS Senior Vice President for Communications Russ Rader attributed the statistic to the fact that there are more vehicles and road trips in unfamiliar territory, creating higher crash risks, on Aug.

buy aricept online www.gcbhllc.org/scripts/html/aricept.html no prescription pharmacy

2 and during the summer in general.

“Traffic deaths are not inevitable. If everyone buckled up and every driver obeyed the laws against speeding and alcohol-impaired driving, the summer death toll would be much lower,” Rader said. “Even though Aug. 2 is a bad day, it’s staggering to recognize that, on average, about 100 people lose their lives on U.S. roads every single day of the year.”

A total of 37,461 people died in motor vehicle crashes in 2016 and the U.S. Department of Transportation’s most recent estimate of the annual economic cost of crashes is $242 billion. Contributing to the death toll are alcohol, speeding, lack of safety belt use and other problematic driver behaviors.

“Each of those deaths could have been prevented,” Rader said. “We could make a lot more progress in reducing crashes and the deaths and injuries that result if we doubled down on the countermeasures that we know work.”

The National Safety Council (NSC) reported that of all the work-related deaths in 2016, nearly 1,600 took place on roadways and about 20% of those involved pedestrian automobiles.

Organizations with fleets should take note, as motor vehicle crashes are the number-one cause of work-related deaths, accounting for 24% of all fatal occupational injuries, according to the NSC. On-the-job crashes cause employers to sustain costs of more than $24,500 per property damage crash and $150,000 per injury crash.

Nationwide’s SmartRide program identified hard braking, fast acceleration and idling in traffic as the top causes of auto accidents. Those incidents, coupled with the fact that August marks the midpoint of summer in America, make this such a dangerous time to be on the road.

Nationwide’s data identifies Fridays in general, between 9 a.m. and 4 p.m., as the most aggressive time of the week for drivers. During this timeframe, drivers’ habits behind the wheel show more instances of hard braking and faster accelerations than any other time of the week. Additionally, Nationwide members reported more accidents in August 2016 (60,976) than any other month over the past four years.

“These critical pieces of data about driving habits have been identified as some of the leading contributors to auto accidents,” said Teresa Scharn, an associate vice president at Nationwide who helped build and manage the insurer’s telematics program. “When drivers are armed with this information, they can make necessary adjustments to their driving behaviors that will help them be safer drivers.”

America’s Safest Driving Cities

Winter weather has yet to appear in many parts of the country, but it’s on its way. When factoring rainy or snowy conditions into collision frequency, however, some cities are safer than others in many types of weather, according to the 2015 Allstate America’s Best Drivers Report.

driversWhile there are many factors that impact highway safety, an improving economy and lower gas prices have led to an increase in the number of miles being driven.

online pharmacy finasteride with best prices today in the USA

According to the Federal Highway Administration’s latest Traffic Volume Trend Report, cumulative travel for 2015 is up by 3.

online pharmacy valtrex with best prices today in the USA

5%. The September report is based on hourly traffic count data reported by the states, using data collected at about 4,000 continuous traffic counting locations nationwide.

Recently, the National Safety Council estimated that the U.S. is on track for its deadliest driving year since 2007. In the first six months of 2015, NSC reported traffic deaths were up 14% from a year ago, and serious injuries were 30% higher over the same period.

The city with the best driving report this year is Kansas City, Kansas. Factoring in precipitation, Cape Coral, Fla., and Brownsville, Tex., came in second and third, respectively. Cities at the bottom of the list of 200 were Boston, Massachusetts; Worcester, Massachusetts; and Baltimore, Maryland. New York City was listed at 151.

The report is based on Allstate’s claims data, ranking America’s 200 largest cities in terms of car collision frequency to identify which have the safest drivers. The data also shows how these cities rank when precipitation is a factor. The rankings are based on the expected driver performance given each city’s average annual precipitation as measured by NOAA, according to Allstate.

America’s safest driving cities:

ABD-Infographic-2015-1