Immediate Vault

NTSB’s Most Wanted Improvements Reflect Major Transportation Disasters of 2018

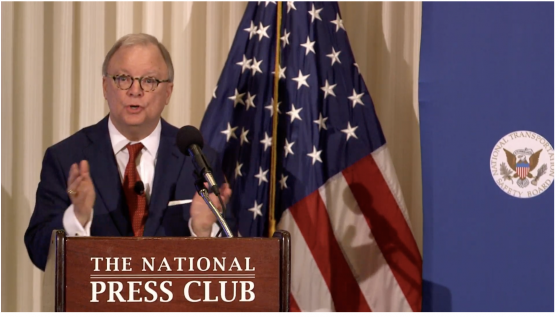
The National Transportation Safety Board (NTSB) unveiled its 2019-2020 Most Wanted List of Transportation Safety Improvements today. The 10-item list is associated with 267 open NTSB safety recommendations that mark critical changes needed in the next two years to reduce transportation accidents, injuries and fatalities, and longstanding safety issues that threaten businesses, professionals and the traveling public.

The list, which is now available online, was unveiled at the NTSB’s press conference in Washington, D.

buy rifadin online achievephysiorehab.ca/wp-content/uploads/2023/10/jpg/rifadin.html no prescription pharmacy

C.:

  • Eliminate Distractions.
  • End Alcohol and Other Drug Alcohol Impairment.
  • Ensure the Safe Shipment of Hazardous Materials
  • Fully Implement Positive Train Control (PTC)
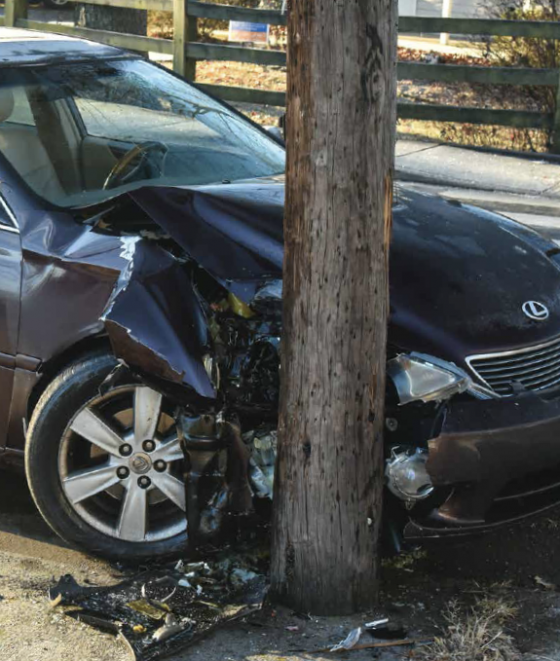
  • Implement a comprehensive strategy to reduce speeding-related crashes
  • Improve the Safety of Part 135 Aircraft Flight Operations
  • Increase Implementation of Collision Avoidance Systems in All New Highway Vehicles
  • Reduce Fatigue-Related Accidents
  • Strengthen Occupant Protection
  • Require Medical Fitness – Screen for and Treat Obstructive Sleep Apnea

“We do not simply come up with these recommendations based on a whim,” NTSB chairman Robert Sumwalt said during his opening remarks. “It’s a data-driven approach based on the results of our investigation and the tragic and senseless deaths we investigate. The NTSB’s most wanted list is written in blood.”

Sumwalt said driving while distracted – from cars to trains – had risen to be one of the most prevalent transportation risks facing American roads, railways, businesses and the general population. Texting-while-driving, he said, can increase the likelihood of a crash between four and 20 times. Sumwalt said the NTSB has called for an outright ban on all mobile devices when operating a vehicle because of the distraction to a driver’s cognitive ability and has urged policymakers to regulate the use of devices like Bluetooth and hands-free phones the same as standard mobile device use.

He also said that nearly 37,000 fatalities were reported on roadways in 2017, the most recent year of data available.

The inclusion of distracted driving dovetails with a study released in January by the Insurance Institute for Highway Safety (IIHS), which highlighted the marked increase in drivers using phones in risky ways. based on an observational survey of drivers in four Northern Virginia communities drivers were 57 percent more likely to be observed manipulating their phones, like when texting or using for purposes other than phone calls.

Based on findings that fatal crash risk is 66 percent higher when manipulating a phone, IIHS researchers estimated that about 800 crash deaths in the United States in 2017 could be attributed to drivers texting or using phones for things other than talking.

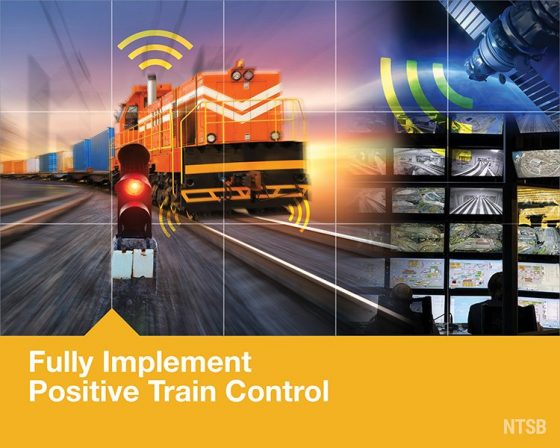
PTC also received special focus during the NTSB panel discussion and press conference. Board member Jennifer Homendy said the most recent data is from the third quarter of 2018 and that, “we are closer to installation but there’s a big difference between installation and operational. We’re a ways away from that, unfortunately. The risk is the same 50 years ago as it was a year ago,” she said, referencing the PTC-preventable crash she investigated exactly one year ago in Cayce, South Carolina.

After Congress passed the PTC Enforcement and Implementation Act of 2015 it also authorized the FAST Act, which allocated $199 million in PTC grant funding and specifically prioritized PTC installation projects for Railroad Rehabilitation and Improvement Financing funding. The Association of American Railroads estimates that freight railroads will spend $10.6 billion implementing PTC, with additional hundreds of millions each year to maintain. The American Public Transportation Association has estimated that the commuter and passenger railroads will need to spend nearly $3.6 billion on PTC.

As previously reported, several major transportation providers, such as AMTRAK and the Long Island Railroad have missed critical deadlines for installing PTC.

buy stendra online achievephysiorehab.ca/wp-content/uploads/2023/10/jpg/stendra.html no prescription pharmacy

“In 1961 President Kennedy set a goal to put a man on the moon by the end of the decade and in July 1969 Neil Armstrong and Buzz Aldrin did that,” Homendy said. “In 1969, NTSB investigated its first PTC-preventable accident. In one decade we put a man on the moon but in five decades we haven’t implemented PTC.”

The Most Dangerous Month For Drivers Has Begun

Now that August has arrived, warnings are being posted—the United States has entered its deadliest month for drivers, according to the Insurance Institute for Highway Safety (IIHS). IIHS information revealed that 505 fatalities have been reported on Aug. 2 every year between 2012 and 2016—the most recent studied—making it the most fatal day for drivers in that time frame.

buy arava online www.gcbhllc.org/scripts/html/arava.html no prescription pharmacy

During the same five-year span, July 4 had the second-highest number of traffic fatalities with 495.

buy sildalis online www.gcbhllc.org/scripts/html/sildalis.html no prescription pharmacy

IIHS Senior Vice President for Communications Russ Rader attributed the statistic to the fact that there are more vehicles and road trips in unfamiliar territory, creating higher crash risks, on Aug.

buy aricept online www.gcbhllc.org/scripts/html/aricept.html no prescription pharmacy

2 and during the summer in general.

“Traffic deaths are not inevitable. If everyone buckled up and every driver obeyed the laws against speeding and alcohol-impaired driving, the summer death toll would be much lower,” Rader said. “Even though Aug. 2 is a bad day, it’s staggering to recognize that, on average, about 100 people lose their lives on U.S. roads every single day of the year.”

A total of 37,461 people died in motor vehicle crashes in 2016 and the U.S. Department of Transportation’s most recent estimate of the annual economic cost of crashes is $242 billion. Contributing to the death toll are alcohol, speeding, lack of safety belt use and other problematic driver behaviors.

“Each of those deaths could have been prevented,” Rader said. “We could make a lot more progress in reducing crashes and the deaths and injuries that result if we doubled down on the countermeasures that we know work.”

The National Safety Council (NSC) reported that of all the work-related deaths in 2016, nearly 1,600 took place on roadways and about 20% of those involved pedestrian automobiles.

Organizations with fleets should take note, as motor vehicle crashes are the number-one cause of work-related deaths, accounting for 24% of all fatal occupational injuries, according to the NSC. On-the-job crashes cause employers to sustain costs of more than $24,500 per property damage crash and $150,000 per injury crash.

Nationwide’s SmartRide program identified hard braking, fast acceleration and idling in traffic as the top causes of auto accidents. Those incidents, coupled with the fact that August marks the midpoint of summer in America, make this such a dangerous time to be on the road.

Nationwide’s data identifies Fridays in general, between 9 a.m. and 4 p.m., as the most aggressive time of the week for drivers. During this timeframe, drivers’ habits behind the wheel show more instances of hard braking and faster accelerations than any other time of the week. Additionally, Nationwide members reported more accidents in August 2016 (60,976) than any other month over the past four years.

“These critical pieces of data about driving habits have been identified as some of the leading contributors to auto accidents,” said Teresa Scharn, an associate vice president at Nationwide who helped build and manage the insurer’s telematics program. “When drivers are armed with this information, they can make necessary adjustments to their driving behaviors that will help them be safer drivers.”

Highway Traffic Deaths Preventable with Better State Laws

A report on highway safety urges state legislatures to examine safety laws and take proactive steps to enact effective rulings. The Advocates for Highway & Auto Safety report “2015 Roadmap of State Highway Safety Laws: Lethal Loopholes,” found that more than 5.6 million crashes in 2013 caused about 32,700 fatalities and 2.3 million injuries. Motor vehicle crashes cost society $871 billion, based on 2010 data.

Federal action and safety requirements can address part of the problem, but state laws have direct impact on promoting safer driver and occupant behavior, according to the report, released in January. An example of the difference state laws can make is with seat belt use, which has been shown to save lives. In 2013, states with primary enforcement seat belt laws for front seat passengers had a 91% belt use rate, while states with secondary enforcement laws had an 80% belt use rate, according to NHTSA data. A study conducted by the Insurance Institute for Highway Safety (IIHS) found that, when states strengthen their laws from secondary to primary enforcement, driver death rates decline by about 7%.

“In 2015, Advocates urges state leaders to close lethal loopholes in their highway safety laws,” Jacqueline S. Gillan, Advocates president, said in the report. “The emotional, economic and societal cost of inaction to improve safety is too high especially considering we know what steps can be taken. Complacency and lack of action have resulted in a dangerous and deadly patchwork of laws across the nation. Lethal loopholes in traffic safety laws are literally killing us—we can and must do better.”

Key facts, according to Advocates:

  • 32,719 people were killed in motor vehicle crashes in 2013—a decrease of 3% from 2012. Automobile crashes remain a leading cause of death for Americans between the ages of five and 34.
  • About 2.3 million people were injured in motor vehicle crashes in 2013.
  • In 2013, almost half (49%) of passenger vehicle occupants killed were unrestrained.
  • Crashes involving young drivers (aged 15 – 20) resulted in 4,333 total fatalities in 2013.
  • 4,668 motorcyclists died in 2013. Though this is a decrease from 2012, this death toll accounts for 14% of all fatalities.
  • 1,149 children age 14 and younger were killed in motor vehicle crashes in 2013.
  • 300 children aged four through seven were killed in motor vehicle crashes in 2013.
  • More than 3.5 million people have been killed in motor vehicle crashes in the U.S. since 1899.
  • The more than 5.6 million police-reported motor vehicle crashes in 2013 had a societal impact in excess of $870 billion. Thirty-two percent of this figure ($277 billion) is economic costs including property and productivity losses, medical and emergency bills and other related costs. Dividing this cost among the total population amounts to a “crash tax” of $897 for every person, every year.

To meet basic safety recommendations, Advocates said states need to adopt 327 new laws:

  • 17 states need an optimal primary enforcement seat belt law for front seat passengers.
  • 33 states need an optimal primary enforcement seat belt law for rear seat passengers.
  • 31 states need an optimal all-rider motorcycle helmet law.
  • 19 states need an optimal booster seat law.
  • 174 graduated driver licensing laws need to be adopted to ensure the safety of novice drivers; no state meets all the criteria recommended in the report.
  • 42 critical impaired driving laws are needed in 39 states and D.C.
  • 11 states need an optimal all-driver text messaging restriction.