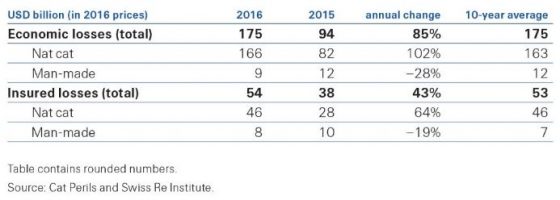
Global Economic losses from disaster events almost doubled in 2016 to $175 billion from $94 billion in 2015, according to the most recent Sigma Study from the Swiss Re Institute.
Insured losses also rose steeply to $54 billion in 2016 from $38 billion in 2015, the study found. This led to a “protection gap,” as the company calls it, of some $121 billion, the difference between economic and insured losses, a figure highly indicative of the opportunity for greater insurance penetration, according to Swiss Re. “The shortfall in insurance relative to total economic losses from all disaster events…indicates the large opportunity for insurance to help strengthen worldwide resilience against disaster events,” said the report. The gap was $56 billion in 2015.
Total economic and insured losses in 2015 and 2016:
The two headline loss figures are the highest since 2012 and end a four-year decline as the year saw a higher amount of significant disaster events including earthquakes, storms, floods and wildfires worldwide. The report noted that some events hit areas with high insurance penetration, leading to the 42% jump in insured losses.
Despite the precipitous rise in both economic and insured losses, human losses plummeted to approximately 11,000 lost or missing in 2016, down from more than 26,000 in 2015.
Of the 327 disaster events last year, 191 were natural disasters while 136 were man-made. Regionally, Asia experienced the most disaster events with 128 leading to approximately $60 billion in economic losses. Asia also had the single most costly disaster event of 2016 as the April earthquake on Kyushu Island, Japan caused an estimated $25 billion-$30 billion in economic losses.
Insured losses of $54 billion almost equaled the $53 million inflation-adjusted annual average of the past 10 years, said the report, despite being 42% higher than 2015’s $38 billion. Natural catastrophes accounted for $46 billion of insured losses, equal to the 10-year annual average, as man-made disasters led to $8 billion of insured losses, according to the report.
“In 2016, both economic and insured losses were close to their 10-year averages.
buy avana online https://royalcitydrugs.com/avana.html no prescription
Insured losses made up about 30% of total losses, with some areas faring much better because of higher insurance penetration,” Kurt Karl, Swiss Re’s chief economist said in a statement.
More than half of insured losses occurred in North America as a record number of severe convective storm events hit the region. These included an April hail storm in Texas, which caused $3.5 billion in economic loss and $3 billion in insured loss as some 86% of losses were covered. An August system brought severe storms and flooding to Louisiana, causing $10 billion in economic loss and $3.1 billion in insured loss.
The region saw several major disaster events.
In May and June, wildfires in Alberta and Saskatchewan, Canada caused $4 billion in economic losses and $2.8 billion in insured losses, Canada’s largest-ever insurance loss. The fire consumed 590,000 hectares of land and caused the evacuation of about 88,000 people. In October, hurricane Matthew, the first Category 5 storm in the North Atlantic since 2007, led to $12 billion in economic losses and $4 billion in insured losses while also, sadly, causing the greatest loss of life as 700 were lost, mainly in Haiti.
Flooding across Europe and China was also devastating at times. In May and June, severe rain and floods hit Belgium, France and parts of Germany, causing economic losses of .
9 billion and insured losses of .
9 billion. Flooding along China’s Yangtze River basin caused an estimated $22 billion in economic losses but low insurance penetration, in contrast to Europe, led to insured losses of just $400 million, according to the report.
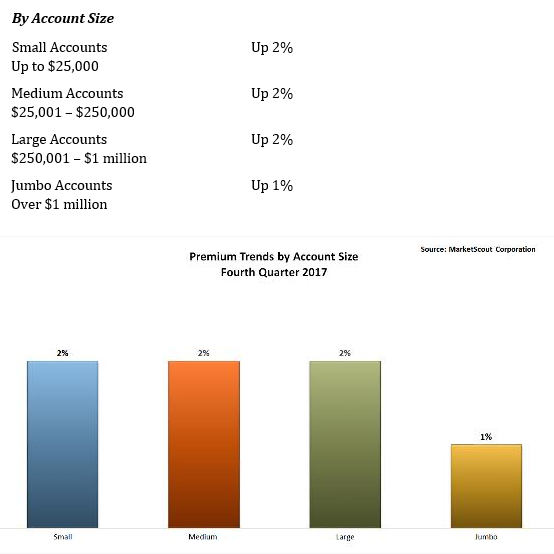
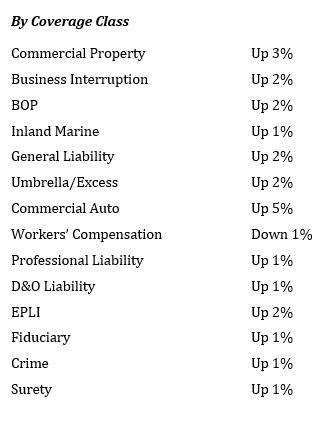 On average, underwriters assessed rate increases for all industry groups except transportation and public entities. “Keep in mind, rates are calculated on a composite basis and represent exposures from businesses across the U.S. Insureds in catastrophe exposed areas incurred higher rates/premiums,” Kerr said.
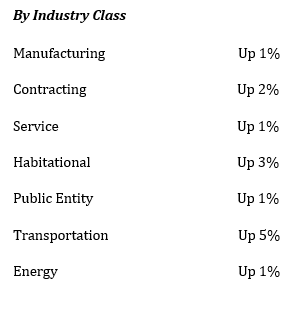
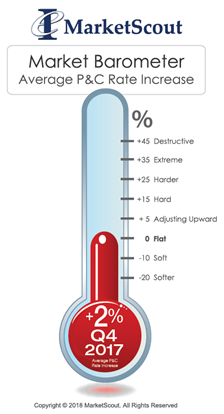
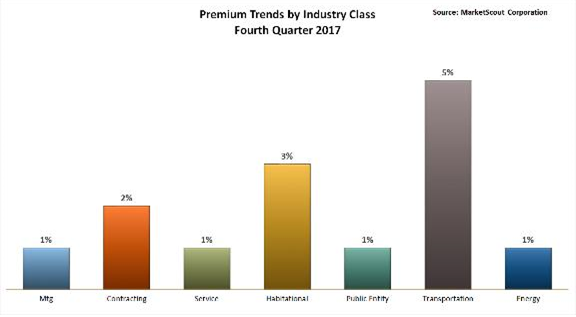 MarketScout also noted that large accounts were seeing increases averaging 1%, while others saw 2% increases.